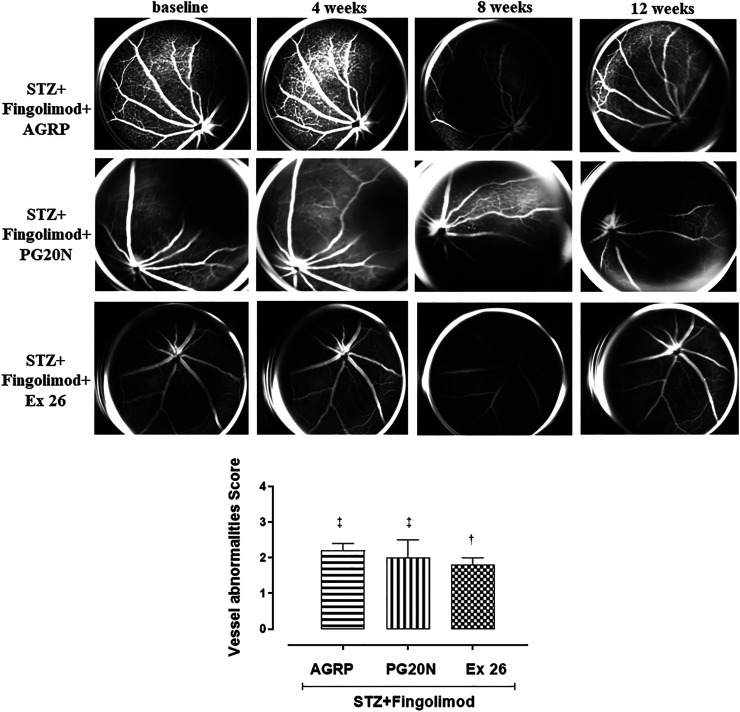
FIGURE 2.
Representative FA images of eyes from diabetic mice treated with Fingolimod and MC1R antagonist (STZ + Fingolimod + AGRP), MC5R antagonist (STZ + Fingolimod + PG20N), and SP1R1 antagonist (STZ + Fingolimod + Ex 26) during the follow-up. The STZ + Fingolimod + AGRP mice showed irregularity of the vessel size, which did not significantly change over time. The STZ + Fingolimod + PG20N group showed a slight progressive thinning of the vascular caliber during the follow-up. In the STZ + Fingolimod + Ex 26 group, neither the appearance of typical signs of RD nor a significant variation of the size or of the vascular course was appreciated, during the follow up. Vessel abnormalities score (graded from 0 to 4) was calculated as the average of the vascular alterations observed (N = 5 animals per group). Vessel abnormalities were graded from 0 to 4 based on the presence of vessel thinning, tortuosity, venous beading, and rosary-like vessels. Each image represents the same retina of the same mouse but at different time points (at baseline, 4–12 weeks of treatment). Statistical significance was assessed by one-way ANOVA, followed by Tukey’s multiple comparison test. † p < 0.05 vs STZ; ‡ p < 0.05 vs STZ + Fingolimod.

