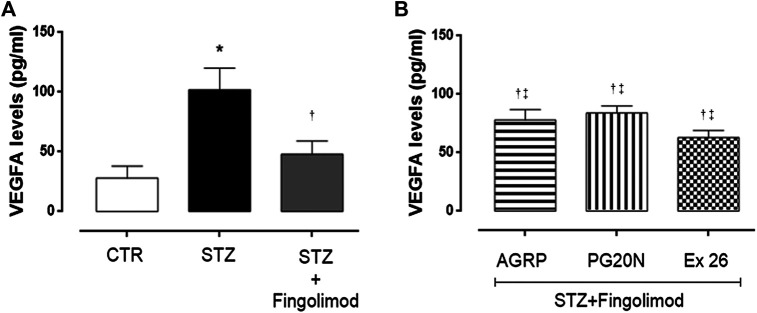
FIGURE 5.
VEGFA levels in retina of non-diabetic mice [panel (A), CTR], diabetic mice [panel (A), STZ], diabetic mice receiving fingolimod alone [panel (A), STZ + Figolimod], or in combination with MC1R antagonist [panel (B), STZ + Fingolimod + AGRP], MC5R antagonist [panel (B), STZ + Fingolimod + PG20N], and SP1R1 antagonist [panel (B), STZ + FTY720+Ex 26]. VEGFA levels, assayed by ELISA, are reported as pg/ml ± S.D. Statistical significance was assessed by one-way ANOVA, followed by Tukey’s multiple comparison test. *p < 0.05 vs CTR; † p < 0.05 vs STZ; ‡ p < 0.05 vs STZ + Fingolimod. N = 10 retinas per group.

