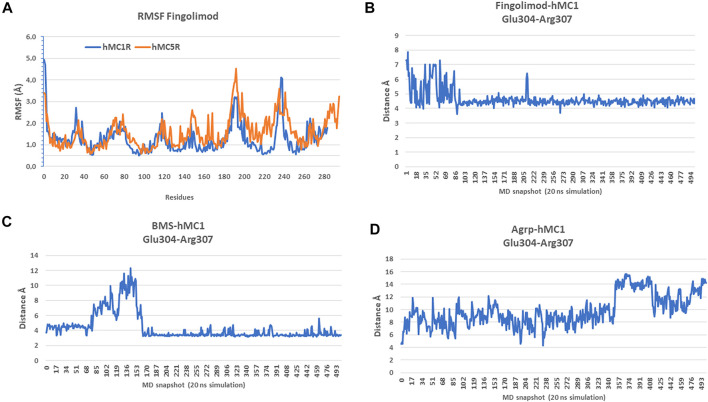
FIGURE 7.
Fingolimod stabilized hMC1R to lower root mean square fluctuations (RMSF), compared to hMC5R. (A) RMSF of fingolimod-hMC1R (blue) complex and fingolimod-hMC5R (orange) complex as mean of 20 ns simulations. (B) Glu304-Arg307 salt-bridge distance during 20 ns simulation of fingolimod-hMC1R complex. (C) Glu304-Arg307 salt bridge distance during 20 ns simulation of BMS-hMC1R complex. (D) Glu304-Arg307 salt bridge distance during 20 ns simulation of Agrp-hMC1R complex.

