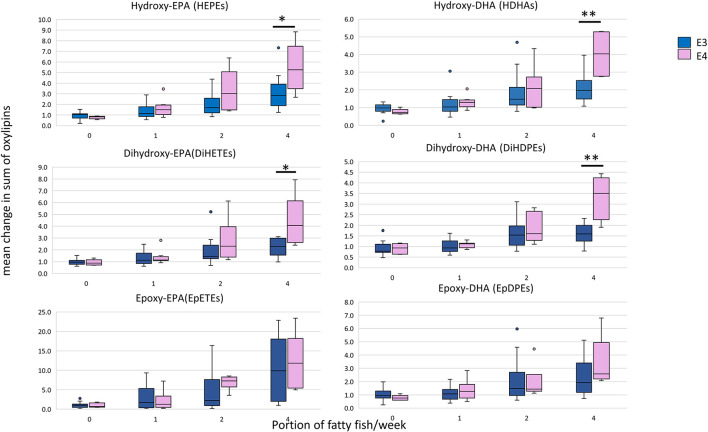
Figure 3.
Box plots showing the mean relative change in oxylipin levels at 12 months with EPA+DHA intake, stratified according to APOE genotype. The concentrations of all HEPEs, HDHAs, EpETEs, and EpDPEs covered by the analytical method were summed from the individual data, i.e., 9 × HEPEs, 10 × HDHAs, 4 × DiHETEs, 5 × DiHDPEs, 3 × EpETEs, and 4 × EpDPEs. Mann-Witney test was used to compare APOE genotypes within each dose. *Statistically significant, P < 0.05; **Statistically significant, P < 0.01. APOE3 n = 66, APOE4 n = 26.

