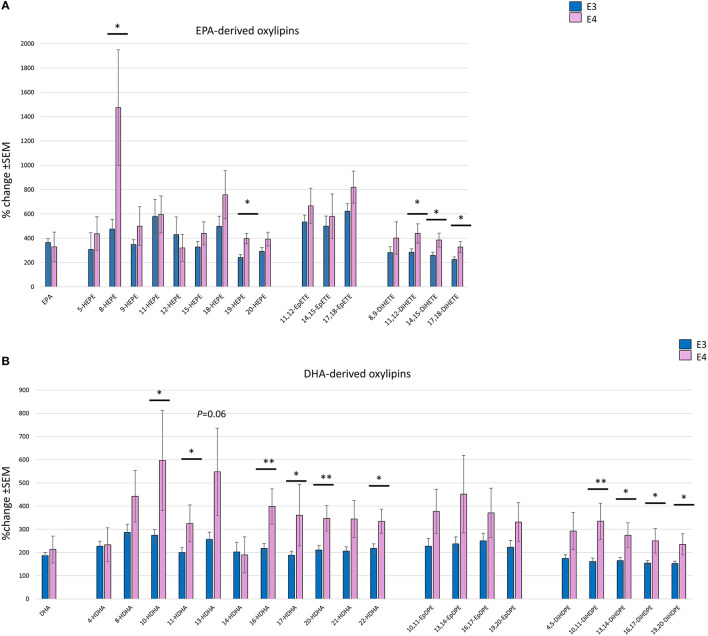
Figure 4.
Bar charts showing the mean % change (with SEM) in individual EPA- (A) and DHA- (B) derived oxylipins, with their parent EPA and DHA following 12 months of supplementation with the equivalent of 4 portions of oily fish, comparing between APOE3 (n = 17) and APOE4 (n = 5/6). Independent sample t-test or Mann-Witney test was used to compare between APOE genotypes. *Statistically significant, P < 0.05, **Statistically significant, P < 0.01.

