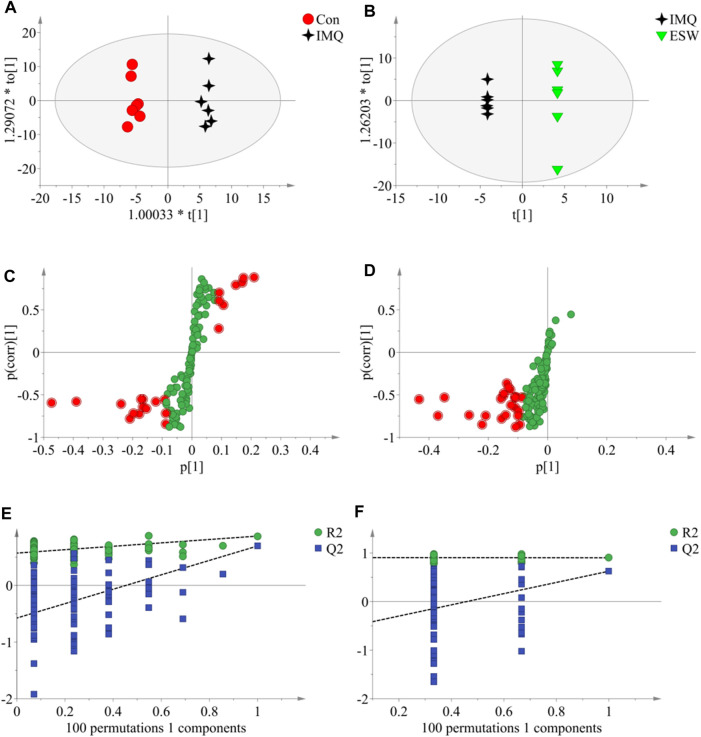
FIGURE 7.
The OPLS-DA data of the serum. (A,B) OPLS-DA score plots comparisons between the Con and IMQ groups as well as the IMQ and ESW groups. (C,D) S-plots of the OPLS-DA model for the Con and IMQ groups as well as for the IMQ and ESW groups. (E,F) The 100-permutation test of the OPLS-DA model was for the Con and IMQ groups as well as for the IMQ and ESW groups.

