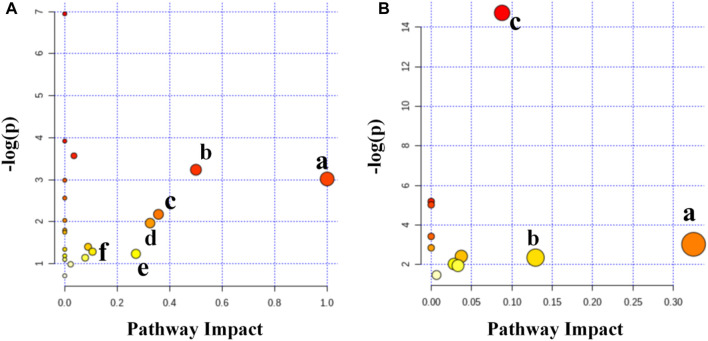
FIGURE 9.
(A) Summary of pathway analysis in the spleen. (a) Linoleic acid metabolism, (b) phenylalanine, tyrosine, and tryptophan biosynthesis, (c) phenylalanine metabolism, (d) starch and sucrose metabolism, (e) glycine, serine and threonine metabolism, and (f) glyoxylate and dicarboxylate metabolism. (B) Summary of pathway analysis in the serum. (a) Starch and sucrose metabolism, (b) inositol phosphate metabolism, and (c) galactose metabolism.

