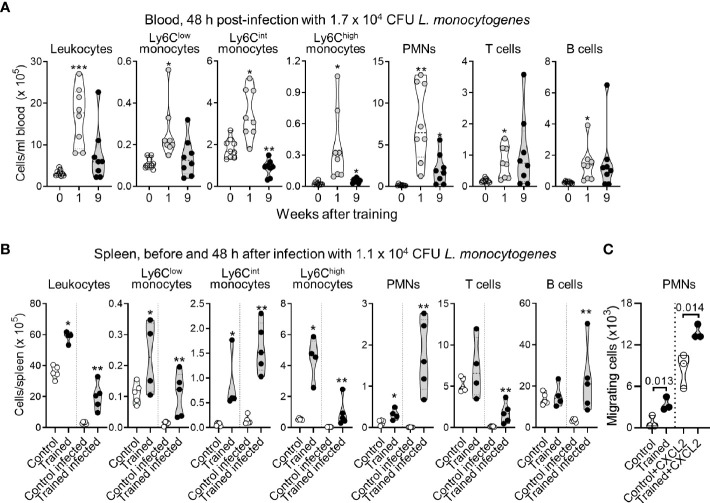
Figure 4.
Impact of training on leukocyte counts in blood and spleen during listeriosis. (A) Control mice (n = 9) and mice trained 1 week and 9 weeks before infection (n = 8 in each group) were challenged i.v. with 1.7 x 10⁵ CFU L. monocytogenes. Blood was collected 2 days after infection to quantify CD45+ leukocytes, Ly6Clow, Ly6Clint and Ly6Chigh monocytes (CD11b+Ly6G-), PMNs (Ly6G+), T cells (CD3+) and B cells (B220+). Each dot in the violin plots represents data from one individual mouse, and the dashed horizontal lines the quartiles. (B) Control mice and mice trained 1 week before infection were challenged i.v. with 1.1 x 10⁵ CFU L. monocytogenes. Spleens were collected before infection (n = 4-5/group) and 2 days after infection (n = 5 mice/group) to quantify CD45+ leukocytes, Ly6Clow, Ly6Clint and Ly6Chigh monocytes, PMNs, T cells and B cells. Each dot of the violin plots represents data from one individual mouse, and the dashed horizontal lines the quartiles. (C) PMNs were isolated from control mice and mice trained 9 weeks before analysis. Spontaneous and CXCL2-dependent migration of PMNs was measured in transwell assay. CXCL2 was used at 25 nM. Migrating cells were enumerated after 1 h. Each dot in the violin plots represents data from one individual mouse. *P < 0.05; **P < 0.01; ***P < 0.001.

