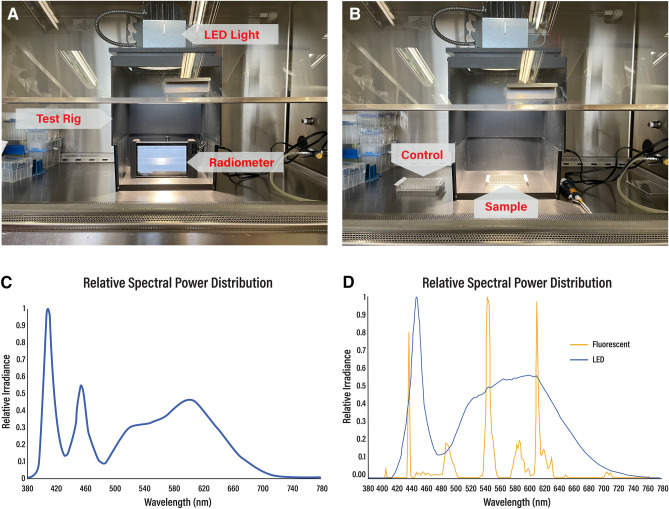
Figure 1.
Inactivation device setup and characterization. (A) Test setup shown with spectroradiometer, and extension used for calibration. (B) Test setup showing the placement of the control and sample for irradiation. The bottom portion of the test rig was removed during the actual experiment to ensure the 10″ distance used in the study. (C) Normalized spectral power distribution showing peak irradiance at 405 nm. (D) Normalized spectral power distribution for the fluorescent control light (non-disinfecting) and standard LED light (without 405 nm) used in the study. Each spectrum is normalized relative to its own peak value.

