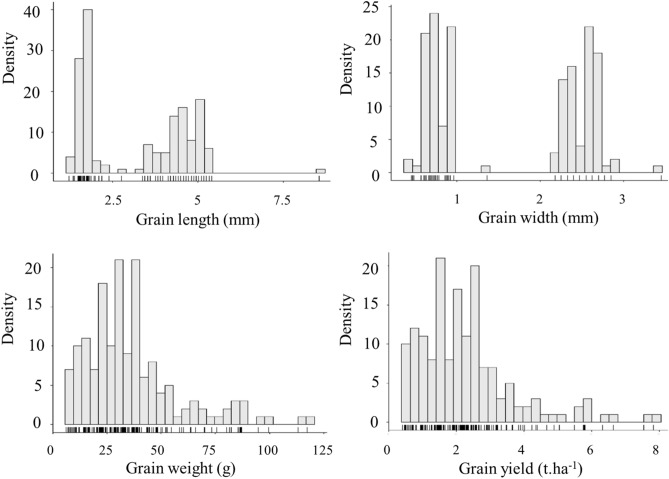
Figure 1.
Distribution of phenotypes for grain length (upper left), grain width (upper right), grain weight (bottom left) and grain yield (bottom right). Histograms are based on the average trait value of each wheat line across the different environments. The bars under the histograms represent the density of individuals. Those phenotypes are referring only to the international panel of wheat and do not include the Canadian accessions.

