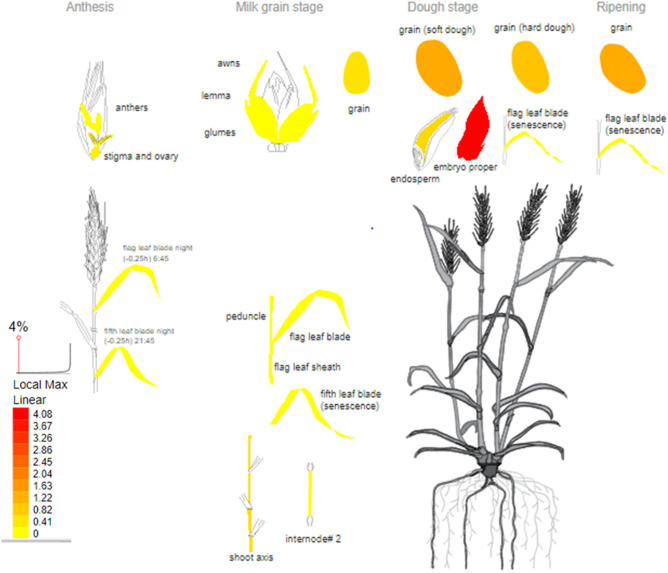
Figure 4.
Expression profile of TraesCS2D01G331100 gene based on transcriptomic analysis in wheat. As shown, this gene is most highly expressed in the developing embryo during embryogenesis and grain development in wheat. Data for this view derived from RNA-seq of wheat48 and the image was generated with the eFP (RNA-Seq data) at http://bar.utoronto.ca/eplant/ by Waese et al.51. The legend at bottom left presents the expression levels, coded by colors (yellow = low, red = high).

