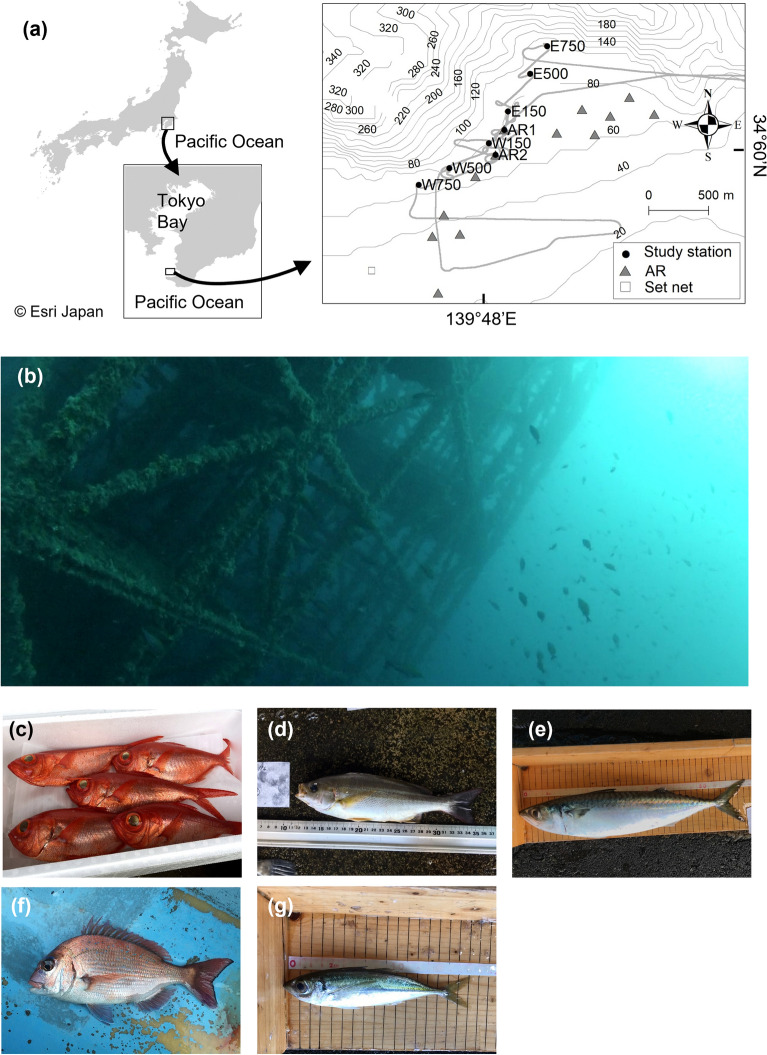
Figure 1.
(a) Location of sampling stations, cruise track, and a set net in Tateyama Bay. Gray areas indicate landmasses, a gray bold line indicates cruise track, and gray thin lines indicate depth contours with an interval of 20 m. The maps were created using ArcGIS Software 10.6.0.8321 by ESRI (https://www.esri.com/) based on the municipal boundary data of Japan (Esri Japan) and Global Map Japan (Geospatial information Authority of Japan) as well as the M7000-series isobath data set (Japan Hydrographic Association). A picture of the artificial reef (AR1) (b) taken one year after this survey (June 2019) and pictures of the dominant species, (c) splendid alfonsino (Beryx splendens), (d) chicken grunt (Parapristipoma trilineatum), (e) chub mackerel (Scomber japonicus), (f) red seabream (Pagrus major), and (g) jack mackerel (Trachurus japonicus). Photograph credits: (b) Nariaki Inoue, (c) Fumie Yamaguchi, (d, e, g) Yutaro Kawano, and (f) Masaaki Sato.

