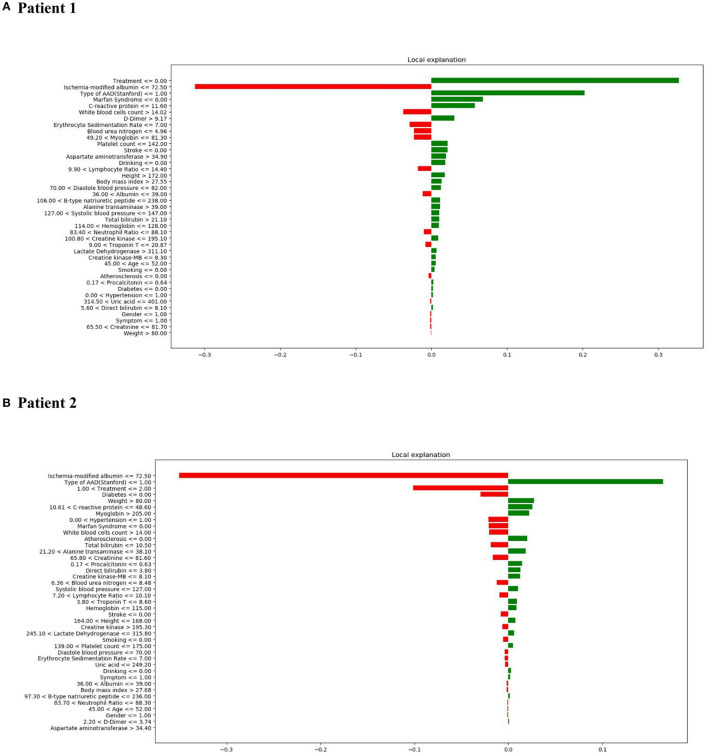
Figure 7.
LIME results with XGBoost classifiers used for two patients with correct predictions (one true positive [in-hospital mortality] patient and one true negative [survival] patient). The contribution of various features to the likelihood of in-hospital mortality are shown for each patient. Each column illustrates the contributions of the features to the probability included in the models. Green represents a positive contribution and red represents a negative contribution. Below the feature, the depicted value signifies the weight coefficient provided by LIME, which is linked to the feature's contribution to the model prediction. (A) LIME explanation for true positive patient 1; (B) LIME explanation for true negative patient 2.

