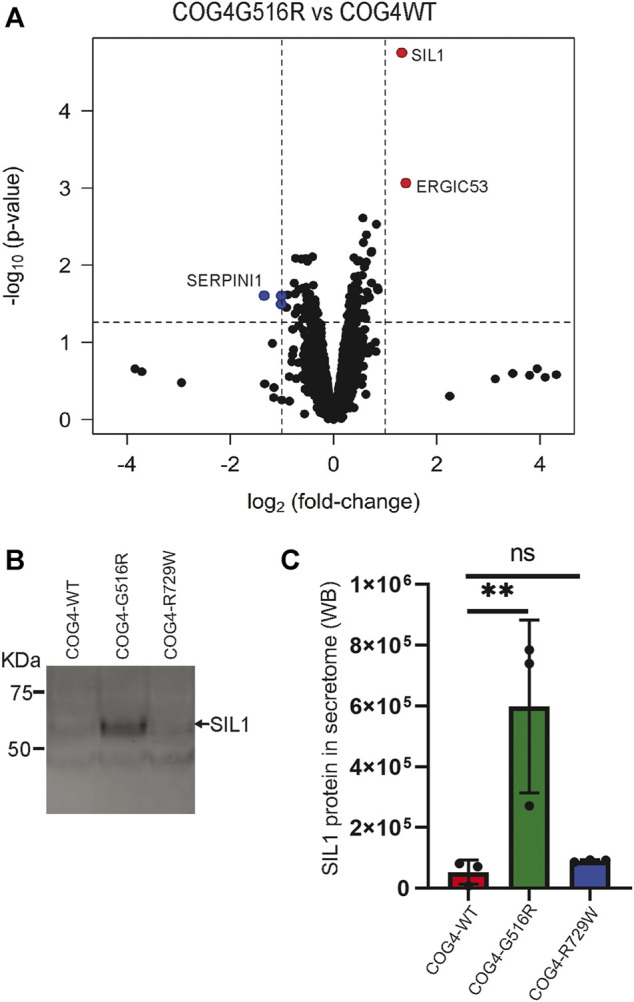
FIGURE 8.

Abnormal secretion of SIL1 and ERGIC53 from COG4-G516R mutant cell line. (A) Volcano plot obtained from quantitative mass spectrometry analysis of protein secretome from RPE1 rescued COG4-WT-3myc and COG4-G516R-3myc cell lines (x-axis represents the log2 of the fold change, the y-axis represents the negative decade logarithm of the significance value). Red dots and blue dots represent proteins that are significantly upregulated and downregulated (B) Western blot analysis of the secretome from three rescued cell lines respectively and stained with the SIL1 antibody. (C) Quantitative analysis of secreted SIL1 protein level. Statistical significance was calculated by GraphPad Prism 8 using One-way ANOVA. **p ≤ 0.01 and non-significant (ns) p > 0.05. Error bar represents mean ± SD.
