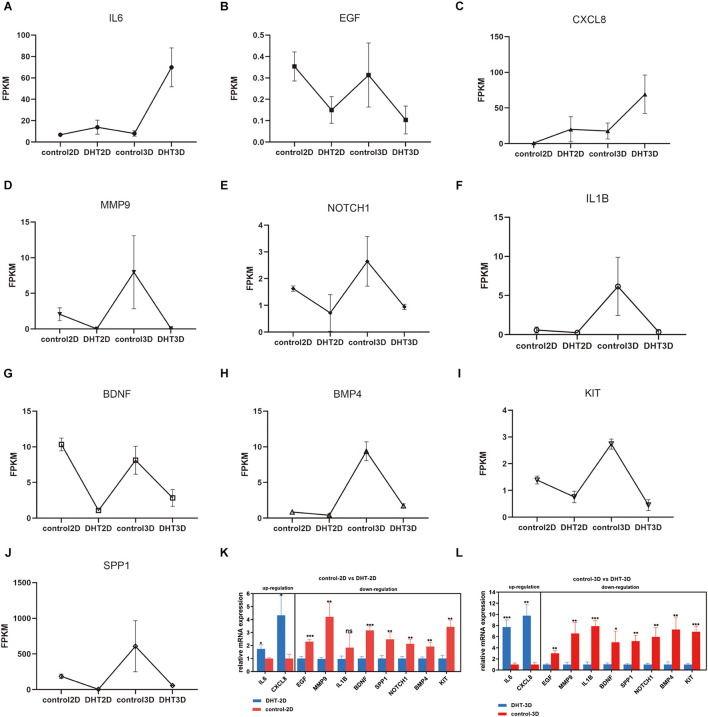
FIGURE 12.
Expression of hub genes and qRT-PCR verification. (A–J) Expression of 10 hub genes in four groups. y-axis item is FPKM. Relative mRNA expression levels of two upregulated and eight downregulated hub genes in the 2D (K) and 3D (L) groups. ns, not significant *p < 0.05; **p < 0.01; ***p < 0.001 when compared with the respective controls by one-way ANOVA and Student’s t-test. FPKM, fragments per kilo base per million mapped reads.

