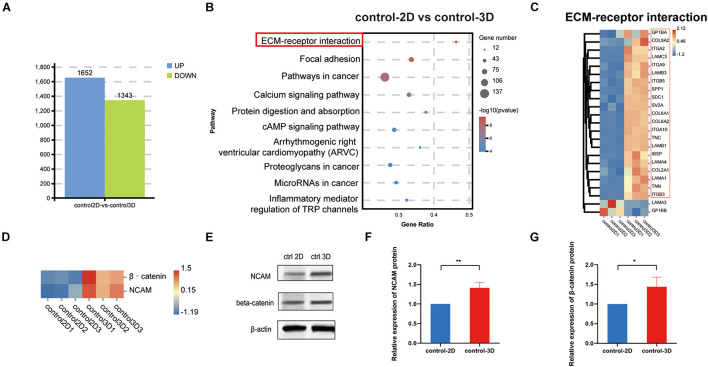
FIGURE 5.
Identification and comparison of 2D and 3D co-culture models in the absence of dihydrotestosterone. (A) Quantity of DEGs in control-2D vs. control-3D groups, displayed as a bar chart. Blue represents upregulation and green represents downregulation. (B) KEGG analysis of DEGs between control-2D and control-3D. The size of the bubble represents gene number, color depth represents the p-value, and the rich ratio represents the gene number/total gene number on the y-axis. (C) DEGs (22) in the control-2D and control-3D related to the ECM–receptor interaction are depicted as a heatmap. Red indicates upregulation and blue indicates downregulation. (D) Expression of β–catenin and NCAM of control-2D and control-3D depicted as a heatmap. Red indicates upregulation and blue indicates downregulation. (E) Western blotting analysis of expression of NCAM and β–catenin and the relative expression of NCAM (F) and β–catenin (G) in control-2D and control-3D DPCs. DEGs, differentially expressed genes; DPC, dermal papilla cell; ECM, extracellular matrix; NCAM, neural cell adhesion molecule. *p < 0.05; **p < 0.01.

