FIGURE 6.
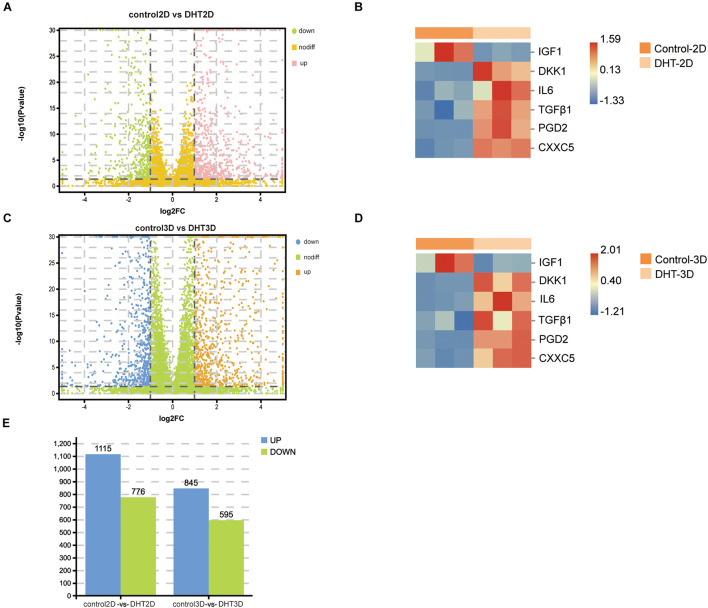
Identification of differentially expressed genes in control-2D vs. dihydrotestosterone-2D and control-3D vs. dihydrotestosterone-3D, and the expression of proven genes. Volcano plot used to determine the DEGs in control-2D vs. DHT-2D (A) and control-3D vs. DHT-3D (C) using the following criteria: p < 0.05 and log2| FC| > 1. Heatmap depicting the expression of six genes in control-2D vs. DHT-2D (B) and control-3D vs. DHT-3D (D). Red indicates upregulation and blue indicates downregulation. (E) Quantity of DEGs in control-2D vs. DHT-2D and control-3D vs. DHT-3D. Blue represents upregulation and green represents downregulation. DEGs, differentially expressed genes; DHT, dihydrotestosterone.

