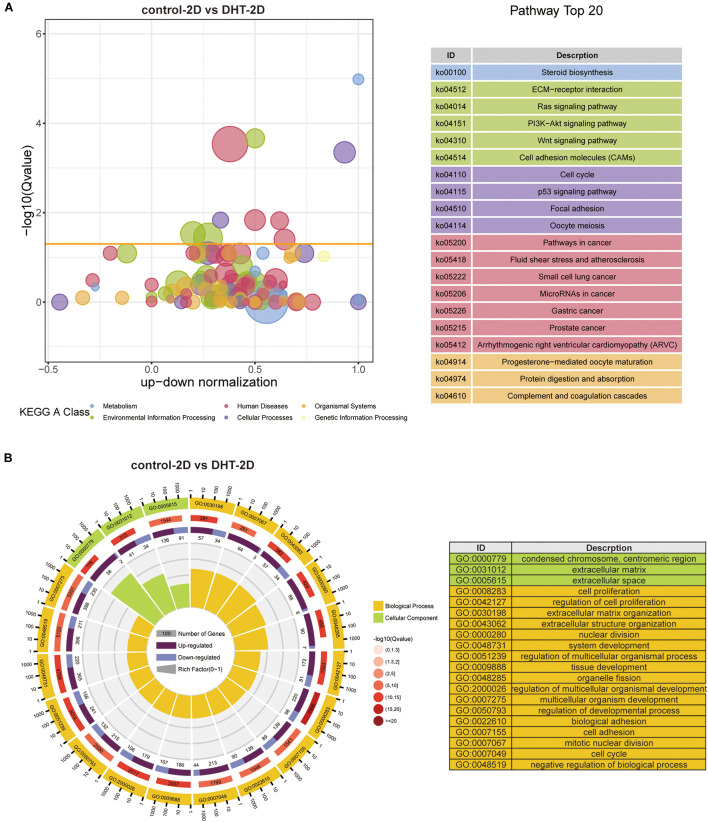
FIGURE 7.
Kyoto Encyclopedia of Genes and Genomes and GO analysis of differentially expressed genes in 2D cultured dermal papilla cells. (A) Blue and red circles indicate metabolism and human diseases, respectively. The green circle indicates environmental information processing, whereas the brown circle represents organismal systems. The purple and yellow circles indicate cellular processes and genetic information processing, respectively. The size of the bubble represents the rich factor (gene number/total gene number), the y-axis represents –log10(Q-value), and the x-axis represents the normalized number of upregulated genes minus downregulated genes. (B) GO analysis of DEGs in 2D. Yellow represents biological process, whereas green represents cellular components. From the exterior to interior; the first lap indicates the top 20 GO terms and the coordinate ruler with the number of genes is presented outside the lap; the second lap indicates the total number of genes in the GO term and –log10(Q-value), wherein the greater number of genes, the longer the strip, and the larger the –log10(Q-value), the darker the color shade; the third lap represents the upregulation/downregulation gene ratio, wherein dark purple represents the upregulated gene proportion, light purple represents the downregulated gene proportion, and the specific value is shown below; and the fourth lap represents the rich factor of each term (number of genes/total number of genes), and each small cell of the background auxiliary line represents 0.1. The chart on the right shows the gene symbols corresponding to the top 20 GO IDs. DEGs, differentially expressed genes.

