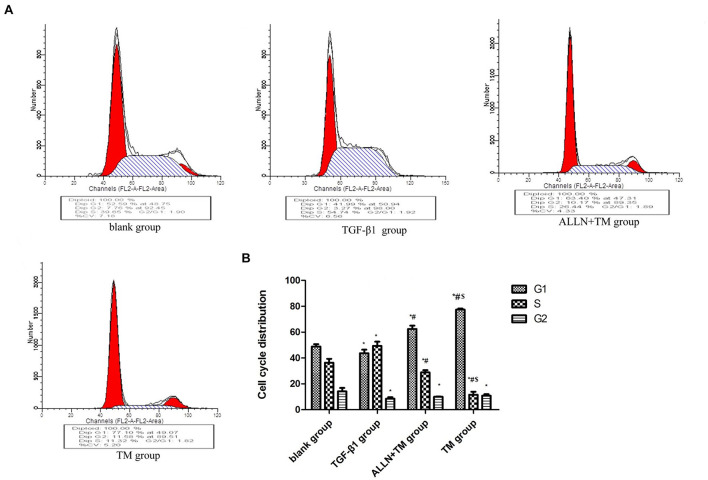
FIGURE 3.
The cell cycle changes in HSC in each group. After treated with TGF-β1, ALLN, and TM, HSC cell cycle of each group was determined by flow cytometric analysis. (A) Figures represent the distribution of different cell cycle phase. (B) Columns represent the percentages of the corresponding cell cycle phase. (*p < 0.05 compared with the blank group; #p < 0.05 compared with the TGF-β1 group; $p < 0.05 compared with the ALLN + TM group).

