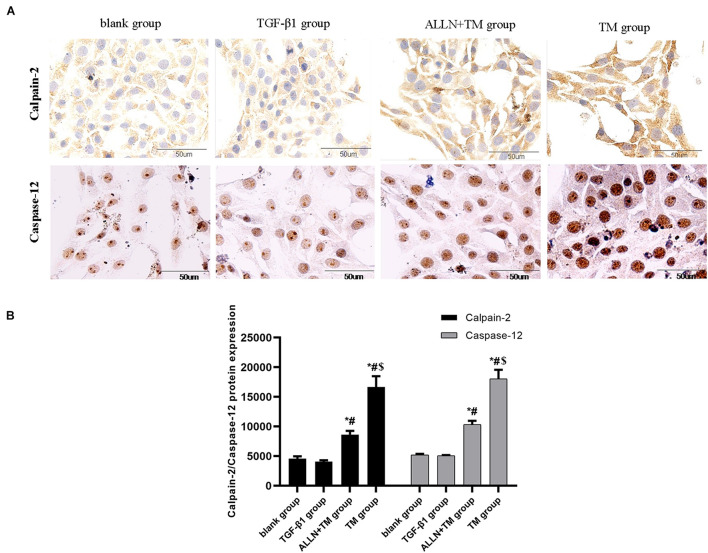
FIGURE 6.
The protein expression level of calpain-2 and caspase-12 in HSC in different groups. Expressions of calpain-2 and caspase-12 protein were detected by immunocytochemistry. (A) Brown part in the figures represent the protein expression in HSC. (B) Columns represent protein expression level of calpain-2 and caspase-12 in HSC (*p < 0.05 compared with the blank group; #p < 0.05 compared with the TGF-β1 group; $p < 0.05 compared with the ALLN + TM group).

