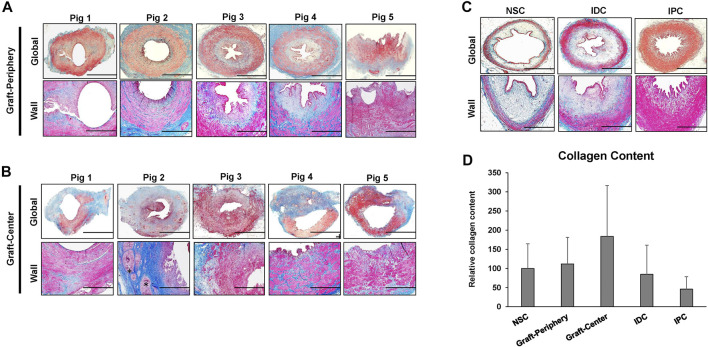
FIGURE 4.
Histological assessments of ureteral tissue architecture in controls and neotissues. Photomicrographs of peripheral (A) and central (B) areas of reconstructed tissues from all swine as well as control groups consisting of NSC, IPC, and IDC segments procured from Pig 5 (C) stained with Masson’s trichrome. Gross cross-sections of ureteral tissues are presented in top rows with magnified views of the ureteral wall displayed in the second row of panels. Scale bars for 1st and 2nd rows in each panel are 1 cm and 400 μm, respectively. A semi-circumferential ureteral section is displayed for the graft-periphery of Pig 5. Asterisk denotes residual scaffold fragments in A-B. (D) Quantitation of collagen content in MTS-stained specimens displayed in (A–C). For all panels, N = 5 animals per group were assessed per data point. For panel D, data were analyzed with Kruskal–Wallis test. p = 0.326. Values are displayed as means ± SD. NSC, nonsurgical controls; IPC, internal proximal controls; IDC, internal distal controls.

