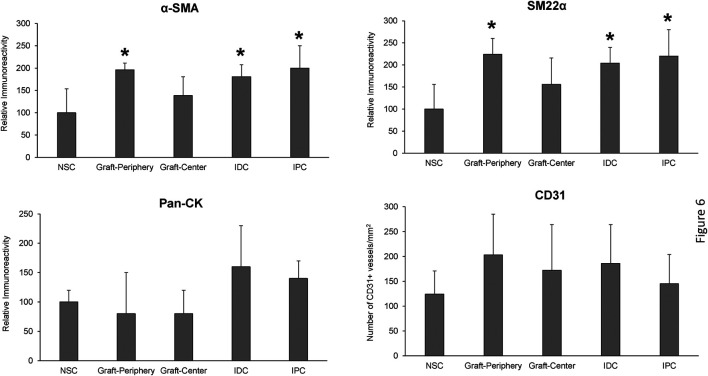
FIGURE 6.
Histomorphometric evaluations of tissue-specific proteins in neoconduits and control groups. Quantitative analyses of marker expression in neotissue regions at 12 weeks post-op and control cohorts following immunohistochemical staining. Values are presented as means ± SD. NSC, nonsurgical controls; IPC, internal proximal controls; IDC, internal distal controls. Results from all groups were analyzed with Kruskal–Wallis and post hoc Dunn’s tests. *p < 0.05 relative to respective NSC levels. N = 5 samples per data point from all swine.

