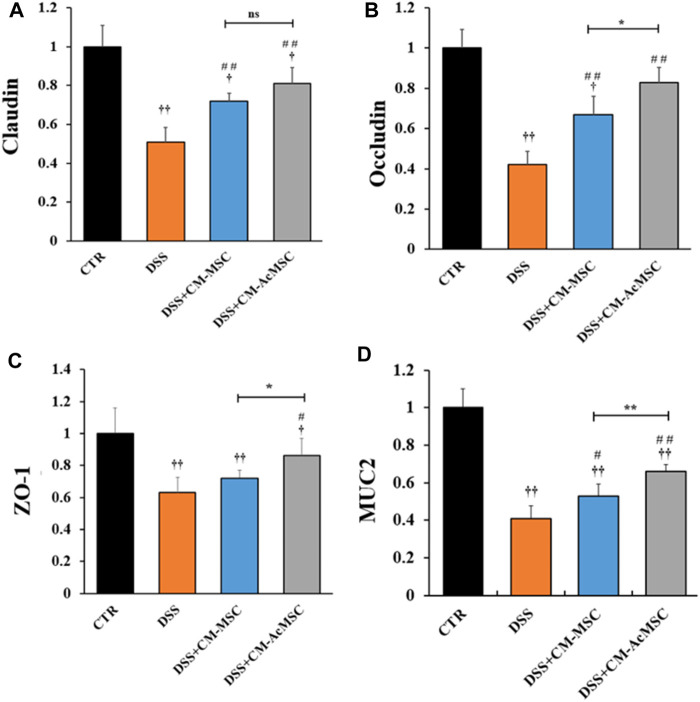
FIGURE 4.
CM-AcMSC enhanced the mRNA expression levels of tight junctions (Claudin, Occludin and ZO-1) and MUC2 in colon tissues, n = 6. The mRNA expression levels determined by real time PCR, normalized by β-actin. (A) Claudin-1. (B) Occludin. (C)ZO-1. (D)MUC2. † p < 0.05, †† p < 0.01 vs CTR; # p < 0.05, ## p < 0.01 vs DSS; * p < 0.05, ** p < 0.01.

