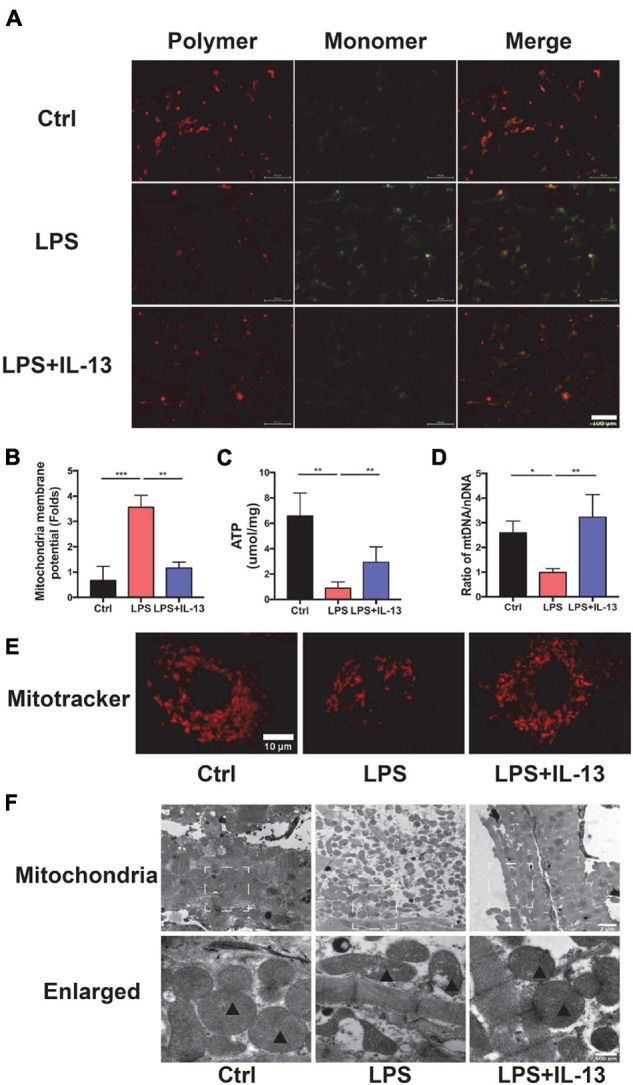
FIGURE 3.

Interleukin-13 recovers homeostasis and morphology of mitochondria. (A) Measurement of mitochondrial membrane potential using the JC-10 probe. (B) Calculation of the membrane potential change ratio with a monomer/polymer. (C) Level of ATP production. (D) mitochondria DNA (mtDNA)/nuclear DNA (nDNA) ratio. (E) Mitochondrial morphology shown by MitoTracker deep red staining. (F) Mitochondrial morphology shown by transmission electron microscope (TEM). Mitochondria was labeled with black triangle. Data are expressed as the mean ± SEM (n = 3). *P < 0.05; **P < 0.01; ***P < 0.001.
