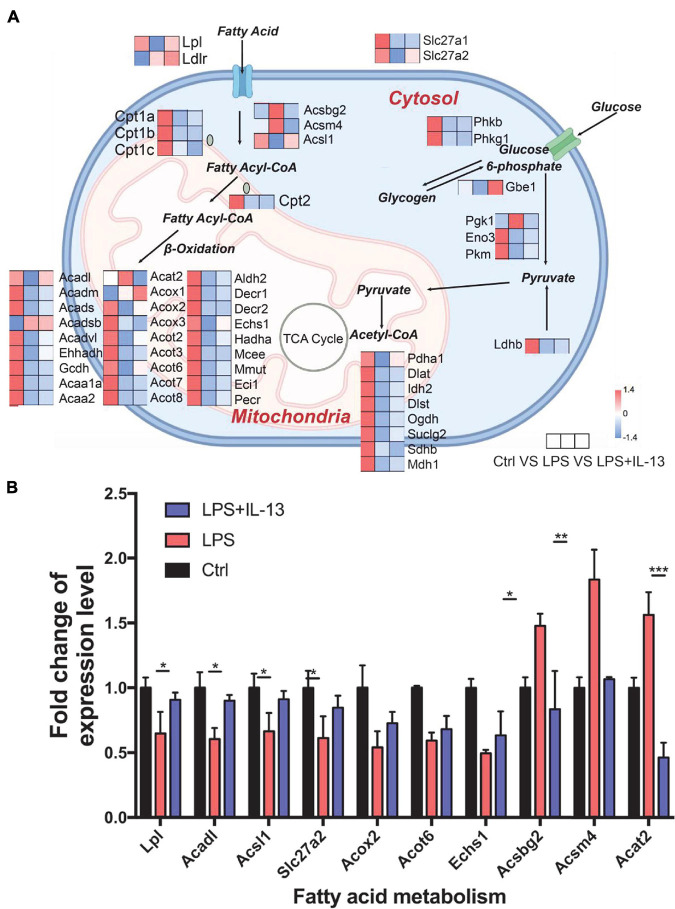
FIGURE 5.
Change of mitochondria biogenesis in LPS-induced cardiomyocytes. (A) Expression level of representative genes related to mitochondria biogenesis by RNA-seq in the mouse heart. Data are presented as a heatmap (n = 6). (B) The expression level of genes related to fatty acid metabolism was validated by RT-qPCR (n = 3). Data are shown as the mean ± SEM. *P < 0.05; **P < 0.01; ***P < 0.001.

