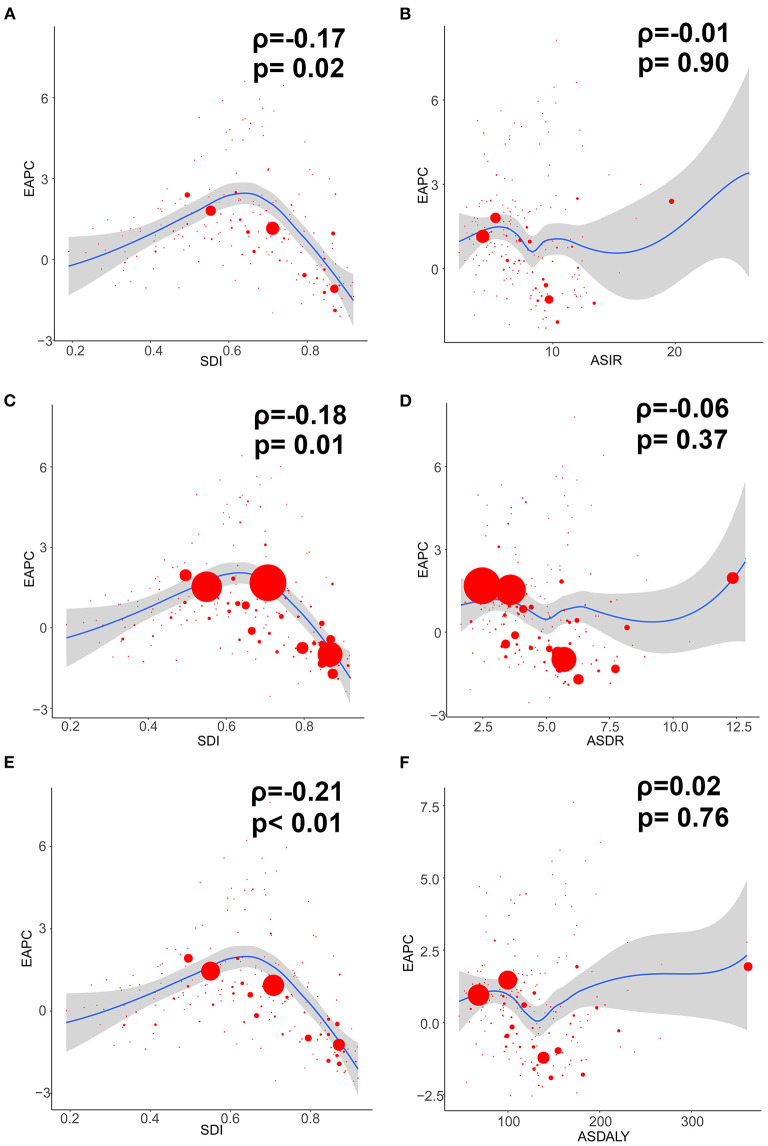
Figure 3.
The correlation between EAPC and ovarian cancer ASR (per 100,000) in 1990 as well as SDI in 2017. The circles represent countries and territories that were available on SDI data. The size of circle is increased with the cases of ovarian cancer. The R and P-values presented were derived from Pearson correlation analysis. (A) EAPC and SDI in incidence; (B) EAPC and ASIR; (C) EAPC and SDI in death; (D) EAPC and ASDR; (E) EAPC and SDI in DALYs; (F) EAPC and age-standardized DALY rate. ASIR, age standardized incidence rate; ASDR, age standardized death rate; EAPC, estimated annual percentage change; SDI, socio-demographic index; DALY, disability adjusted life-year.

