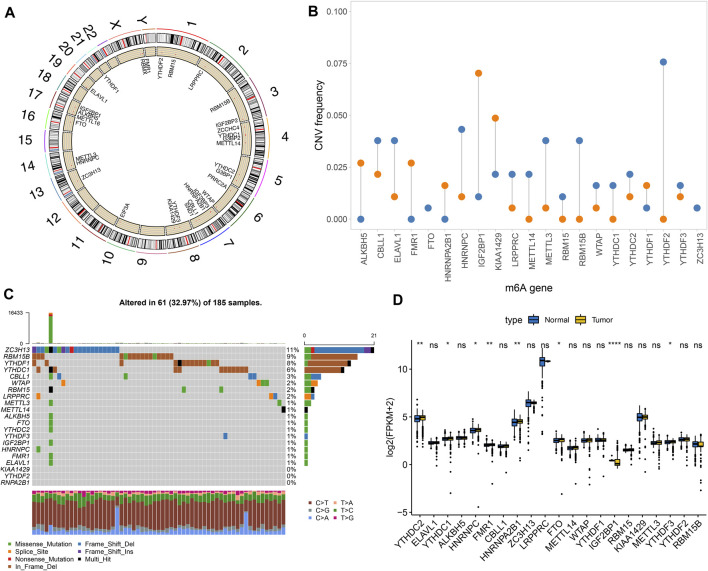
FIGURE 1.
Landscape of genetic mutation and expression patterns of m6A regulators in pancreatic cancer. (A) The locations of m6A regulators on the chromosomes. (B) The distribution of CNV frequency of m6A regulators. Blue indicates deletion and orange indicates amplification. The height of bar indicates the variation frequency. (C) Landscape of somatic mutation of m6A regulators. (D) Box plot of expression patterns of m6A regulators in normal and pancreatic cancer. Ns: not significant; *p < 0.05; **p < 0.01; ****p < 0.0001.

