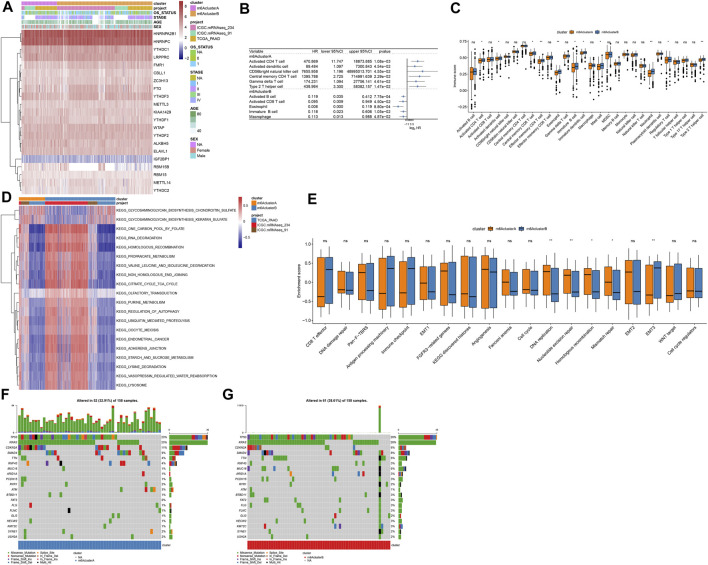
FIGURE 3.
Two m6A methylation modification patterns with distinct immune cell infiltration, biological functions, and genetic mutation. (A) Heatmap of expression patterns of m6A regulators in m6A clusters (cluster A and B), OS status, stage, age, and sex. (B) Associations between immune cells and prognoses of pancreatic cancer. HR: hazard ratio and CI: confidence interval. (C) Box plot of the infiltration levels of immune cells in two m6A clusters. Ns: not significant; *p < 0.05; **p < 0.01. (D) GSVA enrichment analysis for the activation status of biological pathways in two m6A clusters. (E) Box plots of the enrichment scores of key biological processes in two m6A clusters. (F) The somatic mutation landscape of samples in m6A cluster A. (G) The somatic mutation landscape of samples in m6A cluster B.

