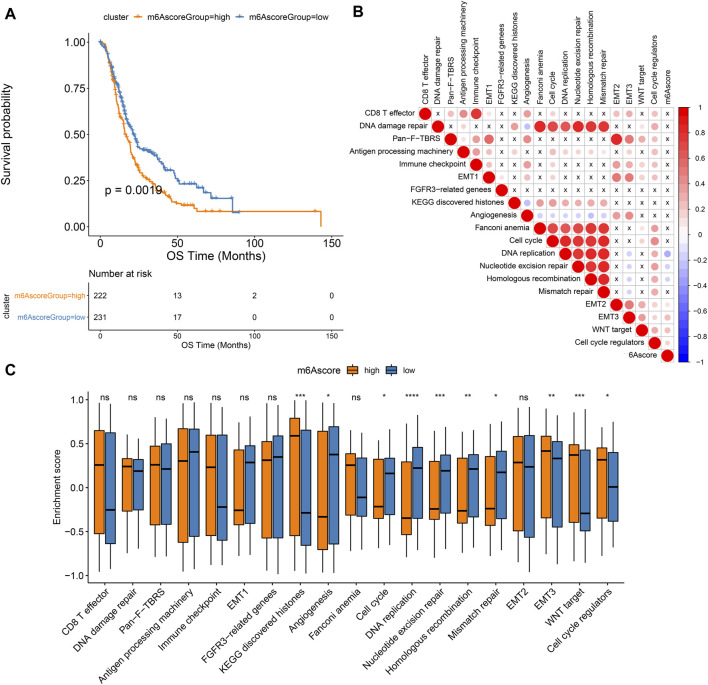
FIGURE 6.
Associations between m6A scores and pancreatic cancer prognoses. (A) Kaplan-Meier curves of patients with high and low m6A scores. (B) Correlation between key biological processes and m6A scores. (C) Box plot of the enrichment scores of key biological processes in high and low m6A score groups. Ns: not significant; *p < 0.05; **p < 0.01; ***p < 0.001; ****p < 0.0001.

