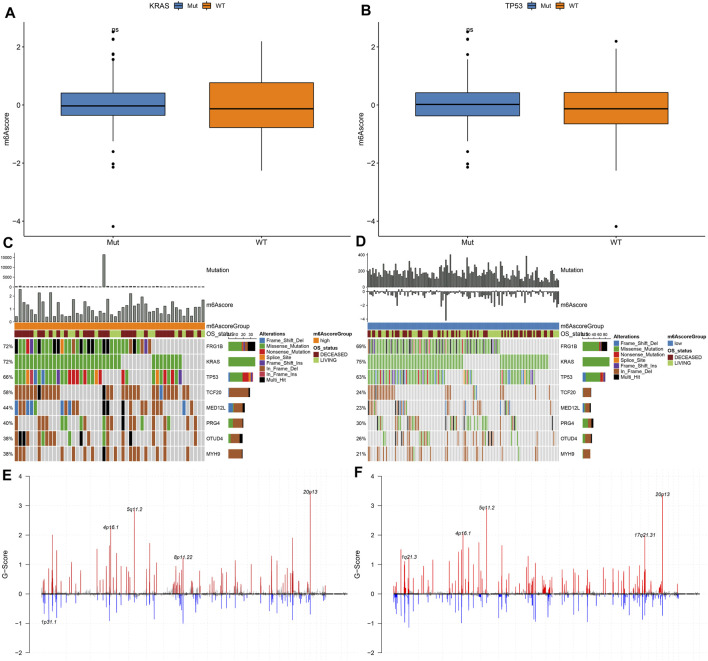
FIGURE 7.
Genetic mutations of samples with high and low m6A scores. (A) Distribution of KRAS mutation in high and low m6A score groups. (B) Distribution of TP53 mutation in high and low m6A score groups. (C,D) The somatic mutation landscape of samples with high and low m6A scores. (E,F) The CNV landscape of samples with high and low m6A scores.

