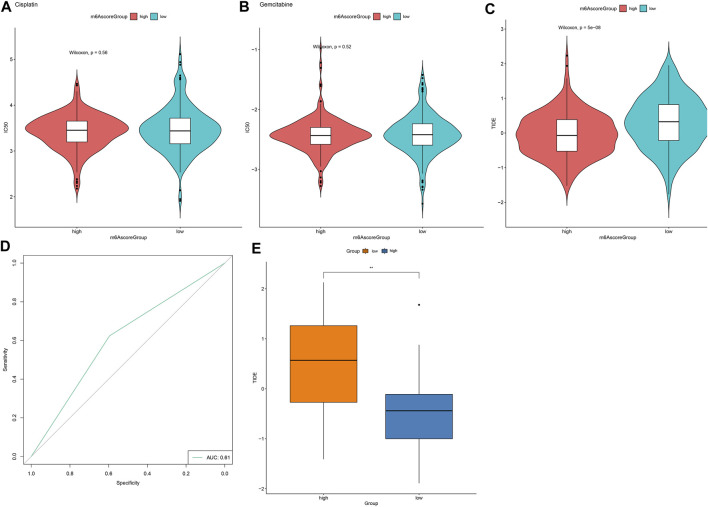
FIGURE 8.
m6A score might be used for predicting the response to immunotherapy. (A,B) Violin plots for visualizing IC50 values of (A) cisplatin and (B) gemcitabine in high and low m6A score groups. (C) Violin plots of TIDE scores in high and low m6A score groups. Comparisons between groups were analyzed with Wilcoxon test. (D) ROC curves for assessing the response to immunotherapy based on m6A scores. (E) Validation of TIDE scores in high and low m6A score groups in the GSE79668 dataset. **p < 0.01.

