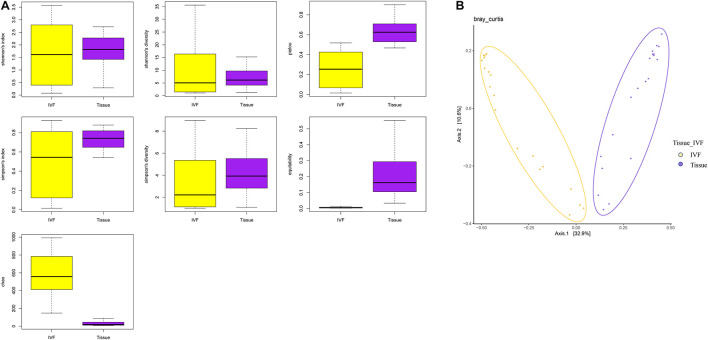
FIGURE 1.
(A) Boxplots represent the indices of observed species. Chao, equitability, Pielou, Shannon’s diversity, and Simpson’s diversity indices in the IVF and tissue groups. IVF, intestinal lavage fluid; tissue, tumor tissue. (B) Beta diversity between the two groups. PCoA analyses. The abscissa is a principal component, the ordinate is another principal component, and the percentage on the coordinate axis indicates the contribution of the two principal components to the sample difference.

