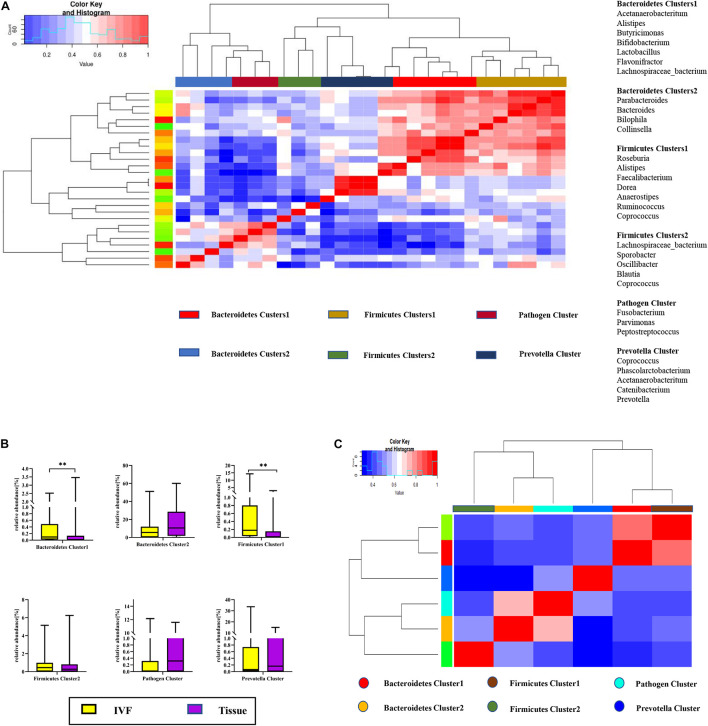
FIGURE 3.
(A) Hierarchical Ward-linkage clustering based on the Pearson correlation coefficients of the relative abundance of operational taxonomic units in IVF and tissue microbiota of 20 individuals with colorectal cancer (CRC). Bacterial clusters were defined based on the clusters in the vertical tree and named after their most notable characteristic. Column color coding is according to the legend below. The right shows the most abundant bacterial genera, and the most strongly connected genera in each bacterial cluster (i.e., genera with the highest numbers of significant positive correlations with other members of each respective group) are listed. (B) Boxplots of the relative abundances of the six co-abundance groups (CAGs) of bacterial clusters, **p < 0.01. (C) Hierarchical Ward-linkage clustering based on the Pearson correlation coefficients of the relative abundance of CAGs in CRC samples (20 individuals).

