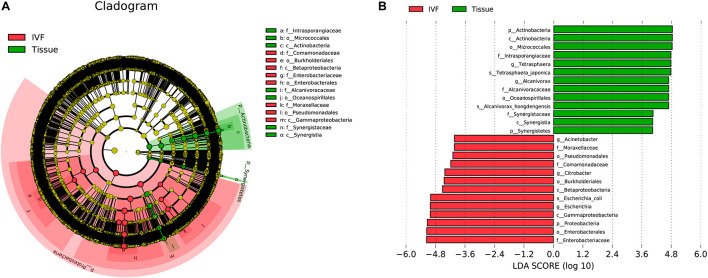
FIGURE 4.
System clustering tree. (A) The red color indicates IVF, the green color represents the tissue. The red nodes represent the key species in the IVF group; the green nodes represent the key species in the tissue group. The yellow nodes represent normal species. The species’ name is on the right side of the figure. (B) The key species in the two groups are analyzed by linear discriminant analysis (LDA) analysis. The LDA score is represented.

