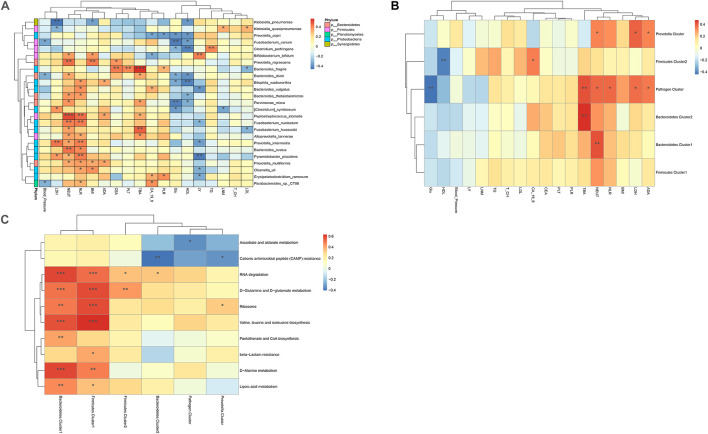
FIGURE 5.
(A) Heatmaps of interactions between species and environmental factors. Environmental factors are on the X-axis, and species are on the Y-axis. (B) Heatmap of the relationship between clusters and environmental factors. The X-axis is the environmental factor, and the Y-axis is the cluster. (C) Heatmap of the relationship between metabolic pathways and clusters. The X-axis shows the clusters, and the Y-axis shows the metabolic paths. The R-value (rank correlation) and the p-value of the corrected error finding rate were calculated. The R values are shown in different colors in the figure. The legend on the right is the color code of the different R values. *p < 0.05, **p < 0.01, ***p < 0.001.

