FIGURE 6.
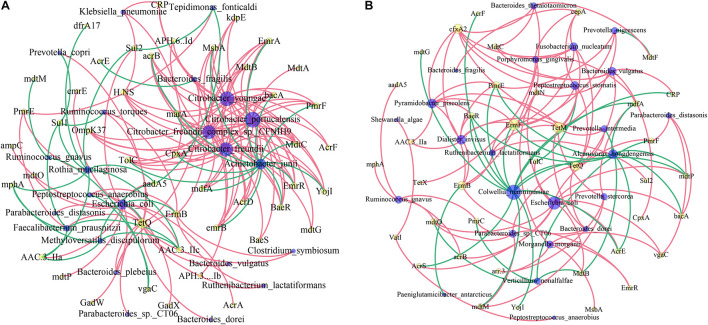
Network analysis of co-occurrence patterns among antibiotic resistance gene (ARG) subtypes and microbial taxa in IVF (A) and tissue (B). The nodes are colored according to ARG types and species. A connection represents a strong (Spearman’s correlation coefficient r > 0.4) and significant (p < 0.05) correlation. The size of each node is proportional to the number of connections.

