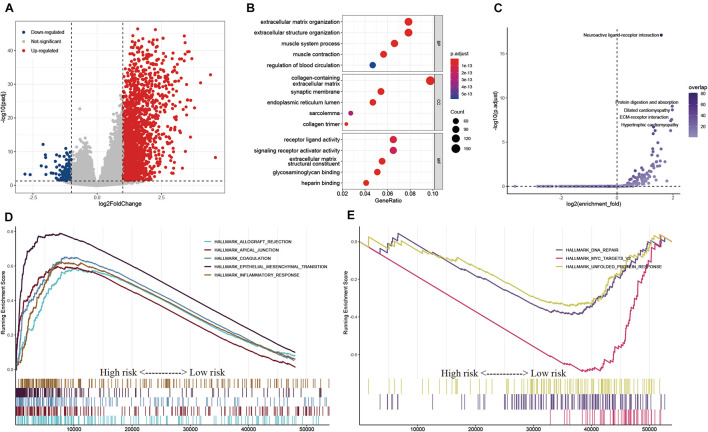
FIGURE 9.
Exploration of the potential regulatory mechanisms resulting in the differences of TIME between the low- and high-risk groups. (A) Volcano plot of DEGs between the low- and high-risk groups. (B,C) GO (B) and KEGG (C) enrichment analyses of DEGs. (D,E) Hallmarks were significantly enriched in the high-risk (D) and low-risk (E) groups.

