FIGURE 1.

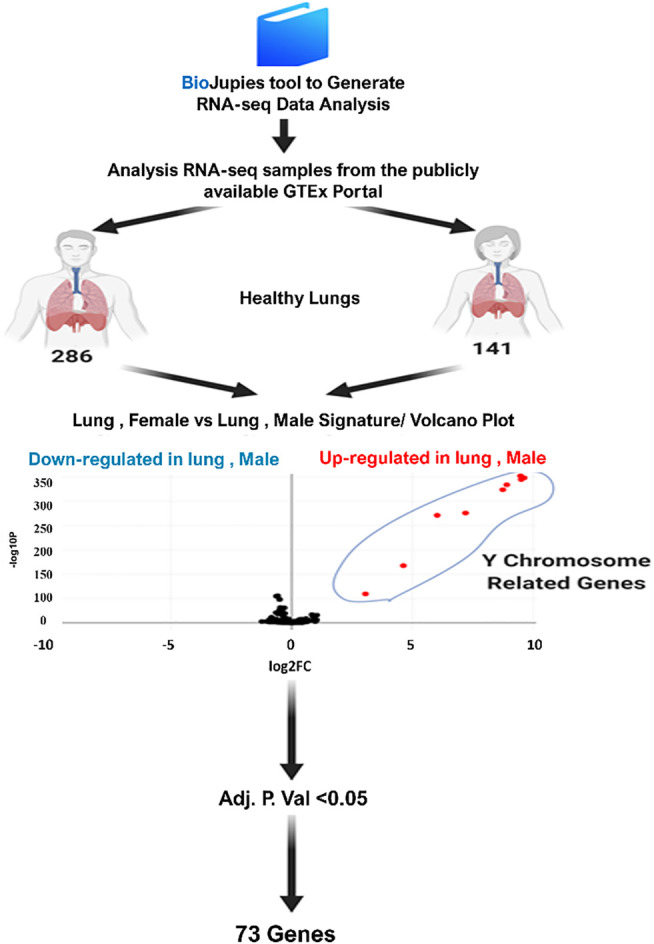
Schematic representation to bioinformatics analysis of differentially expressed genes in males compared to females’ lung tissues using BioJupies tools (Caramelo et al., 2020).

Schematic representation to bioinformatics analysis of differentially expressed genes in males compared to females’ lung tissues using BioJupies tools (Caramelo et al., 2020).