
FIGURE 1.
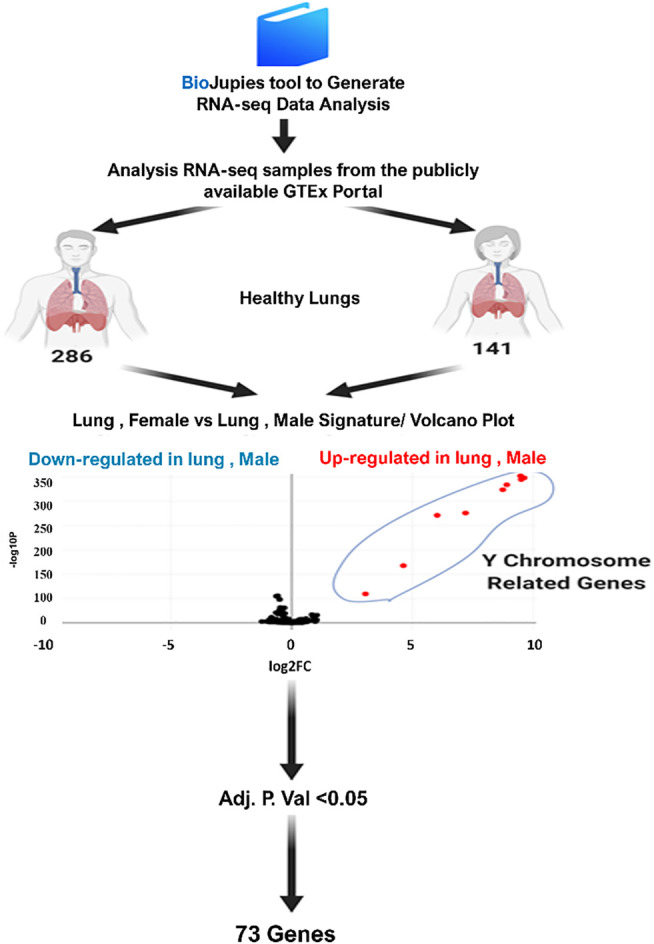
Schematic representation to bioinformatics analysis of differentially expressed genes in males compared to females’ lung tissues using BioJupies tools (Caramelo et al., 2020).
Official websites use .gov
A
.gov website belongs to an official
government organization in the United States.
Secure .gov websites use HTTPS
A lock (
) or https:// means you've safely
connected to the .gov website. Share sensitive
information only on official, secure websites.
Schematic representation to bioinformatics analysis of differentially expressed genes in males compared to females’ lung tissues using BioJupies tools (Caramelo et al., 2020).