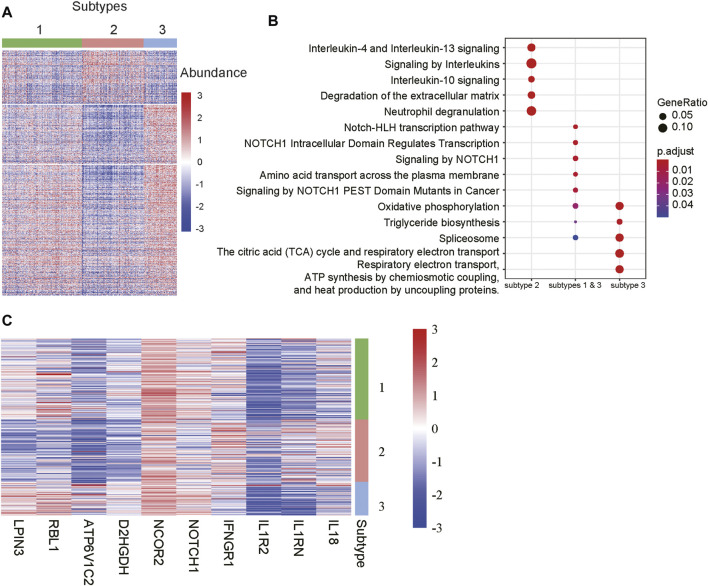
FIGURE 4.
Differentially expressed genes and pathways among the subtypes. (A) The gene expression profiles of the differentially expressed genes (DEGs) among the subtypes. The colors on the top represent the subtypes. The red and blue colors in the heatmap indicate high and low expression, respectively. (B) The signaling pathways enriched by the DEGs. The x-labels such as subtype 2, subtype 1 & 3, and subtype 3 represent the pathways enriched by the DEGs upregulated in subtypes 2, both 1 and 3, and 3, respectively. (C) The representative genes differentially expressed in the subtypes.

