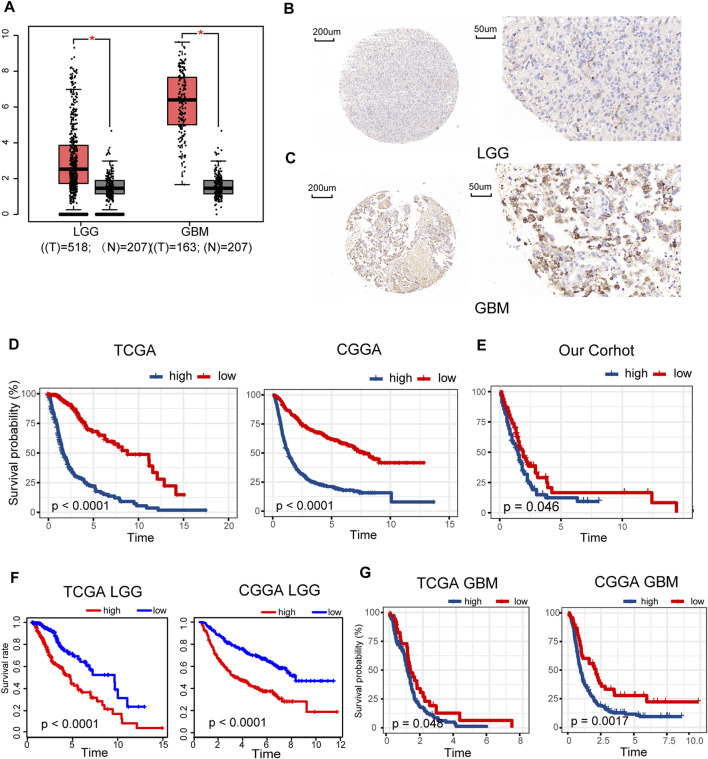
FIGURE 1.
Clinical prognostic value of METTL7B expression in LGG and GBM patients. (A) METTL7B expression of normal brain tissues from GTEx data (n = 207) compared with expression in LGG (n = 518) and GBM (n = 163) samples retrieved from TCGA database. (B–C) Representative specimens exhibiting METTL7B IHC labeling pattern in LGG and GBM. (D–E) Survival analysis of patients with glioma in high METTL7B and low METTL7B groups in the TCGA, CGGA, and our cohort. (F) KM survival curve of patients with LGG in high METTL7B and low METTL7B groups in TCGA and CGGA datasets. (G) KM survival curve of patients with GBM in high METTL7B and low METTL7B groups in TCGA and CGGA datasets. *p < 0.05, **p < 0.01, ***p < 0.001, and ****p < 0.0001.

