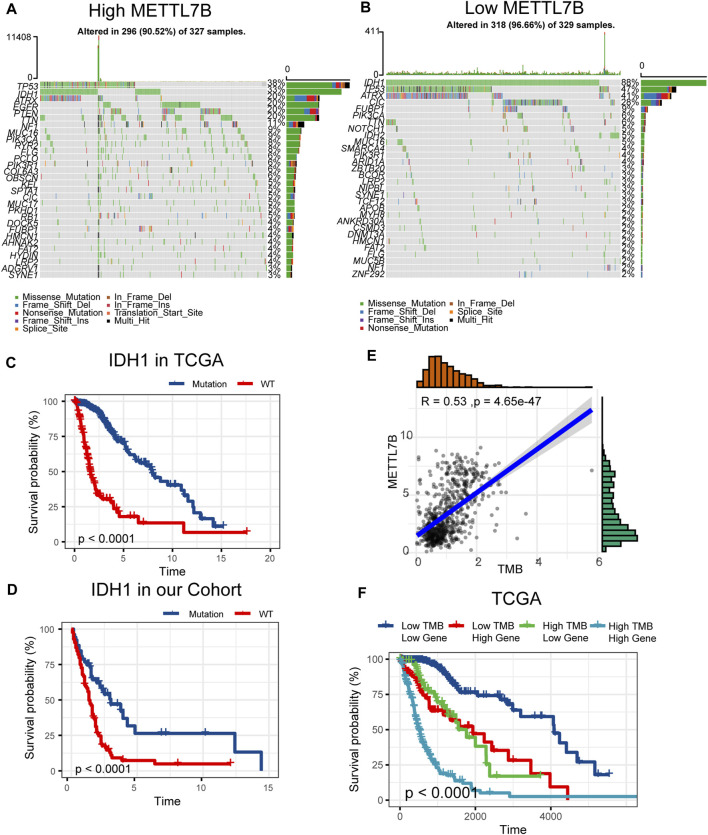
FIGURE 5.
Differences in somatic mutations related to METTL7B expression. (A–B) Top 30 most frequently mutated genes between high and low METTL7B groups. (C–D) Survival analysis of gliomas with different IDH1 status in the TCGA dataset and our cohort. (E) Correlation curve between METTL7B and the level of TMB. (F) Survival analysis of gliomas between different TMB scores and high or low METTL7B expression levels.

