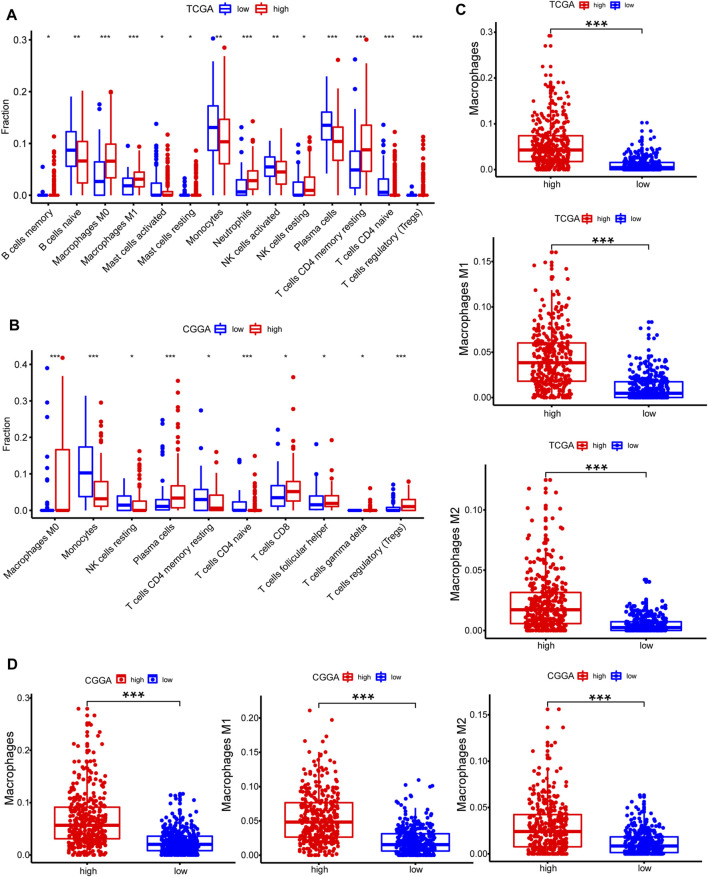
FIGURE 6.
Estimation of immune cell-type fractions in glioma. (A–B) Difference in distribution of immune cell types in tumor microenvironment between low METTL7B and high METTL7B groups from 697 samples in TCGA and 693 samples in CGGA datasets as determined using CIBERSORT. (C–D) Analysis using xCell showed that TAMs were significantly higher in the high METTL7B expression group. *p < 0.05, **p < 0.01, ***p < 0.001, and ****p < 0.0001.

