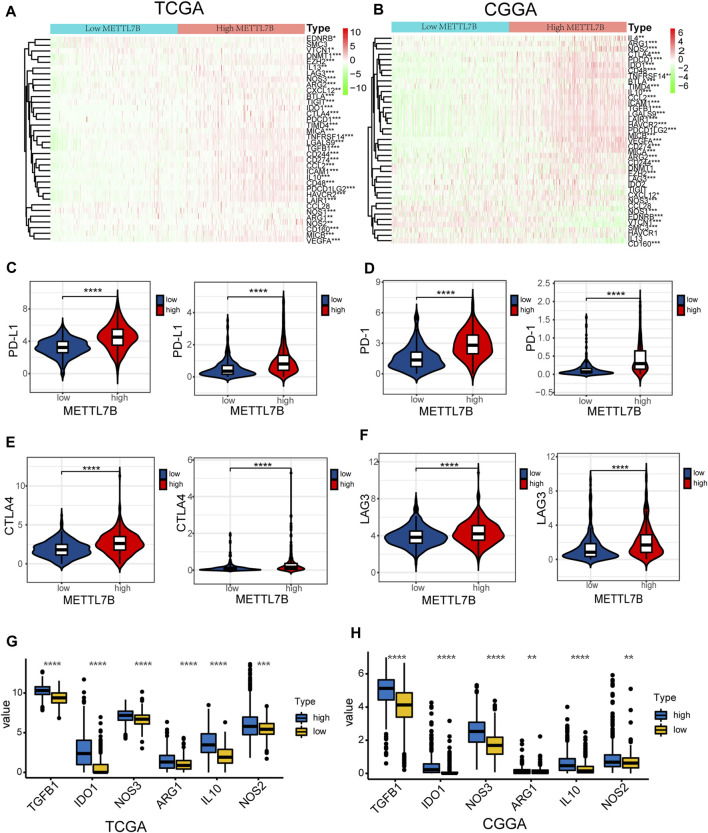
FIGURE 7.
High METTL7B expression indicates an immunosuppressive microenvironment. (A–B) Heatmap of profiles of genes involved in negative regulation of the Cancer-Immunity Cycle in high and low METTL7B groups in the TCGA and CGGA datasets. (C–F) PD-L1, PD-1, CTLA4, and LAG3 expression levels in high and low METTL7B groups. (G–H) Tumor immunosuppressive cytokine expression in high and low METTL7B groups. *p < 0.05, **p < 0.01, ***p < 0.001, and ****p < 0.0001.

