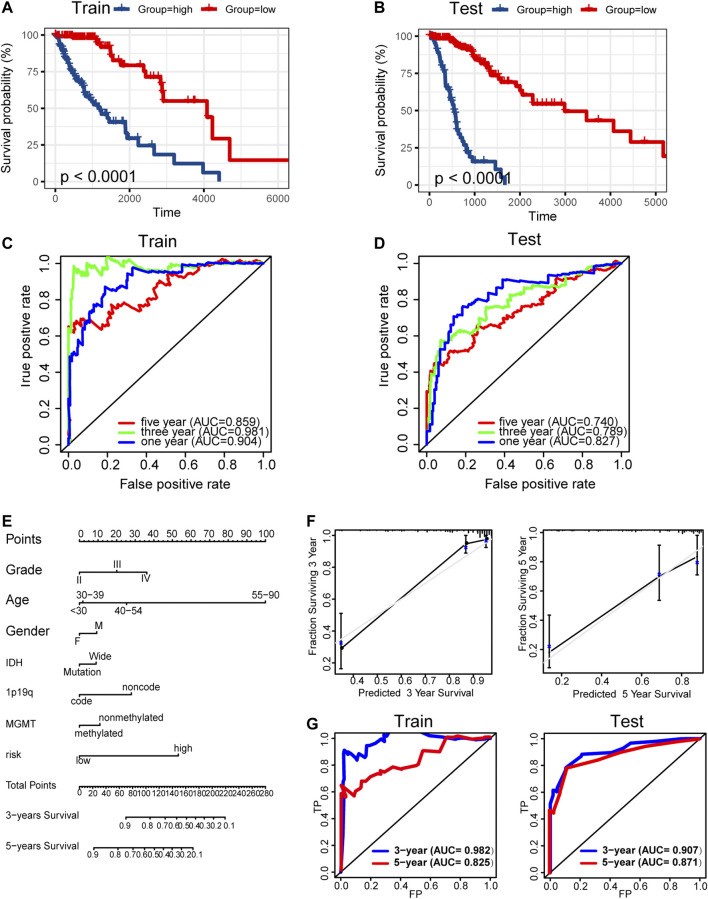
FIGURE 9.
Construction and validation of prognosis prediction model. (A–B) Kaplan–Meier overall survival curves for gliomas assigned to high and low risk groups based on risk score in the training and test sets. (C–D) ROC curves showing predictive efficiency of the risk signature on 1-year, 3-year, and 5-year survival rate. (E) Nomogram for predicting 3- and 5-year overall survival with risk signature and clinical information in the training set. (F) Calibration curve of the nomogram using the training set. (G) ROC curves of the prediction index value in predicting 3- and 5-year overall survival of the training and test nomogram.

