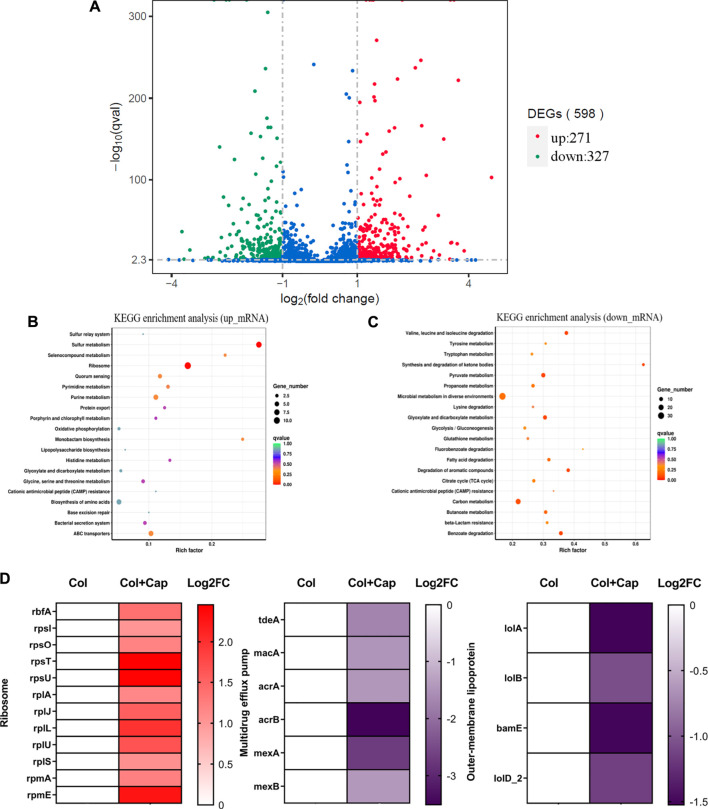
FIGURE 8.
Transcriptome analysis of ATCC19606-R after exposure to colistin (2 μg/mL) alone or the combination of colistin (2 μg/mL) plus capsaicin (32 μg/mL). (A): Differential gene volcano map. (B): KEGG enrichment analysis of up-regulation genes. (C): KEGG enrichment analysis of down-regulation genes; the color of the dot represents the size of the Q value, and the size of the dot represents the number of differential genes. (D): Differentially expressed genes of ribosomes, multidrug efflux pump and outer membrane lipoprotein. Col: colistin alone; Col + Cap: the combination of colistin and capsaicin.

