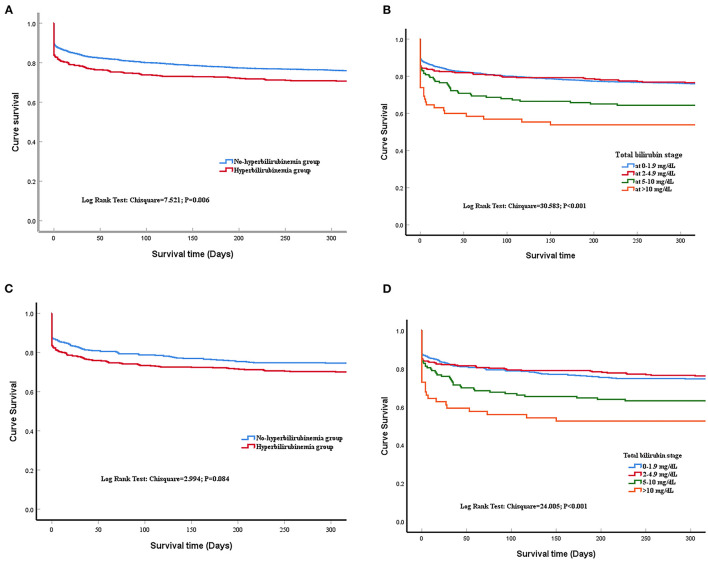
Figure 2.
Time to death analysis. (A) shows the survival curves for all included patients at 1 year after admission of the last patients before matching, with a significant difference between liver injury and non-liver injury groups (Log-rank P = 0.006). (B) shows the survival curves for different stages of serum total bilirubin (TBIL) levels before propensity matching. Kaplan-Meier analysis showed survival time did not differ between the hyperbilirubinemia group and the normal group. Log-rank p < 0.001. (C) shows the survival curves between liver injury and non-liver injury groups after matching (log-rank P = 0.084); (D) shows the survival curves for different stages of serum TBIL levels after propensity matching (Log-rank p < 0.001).

