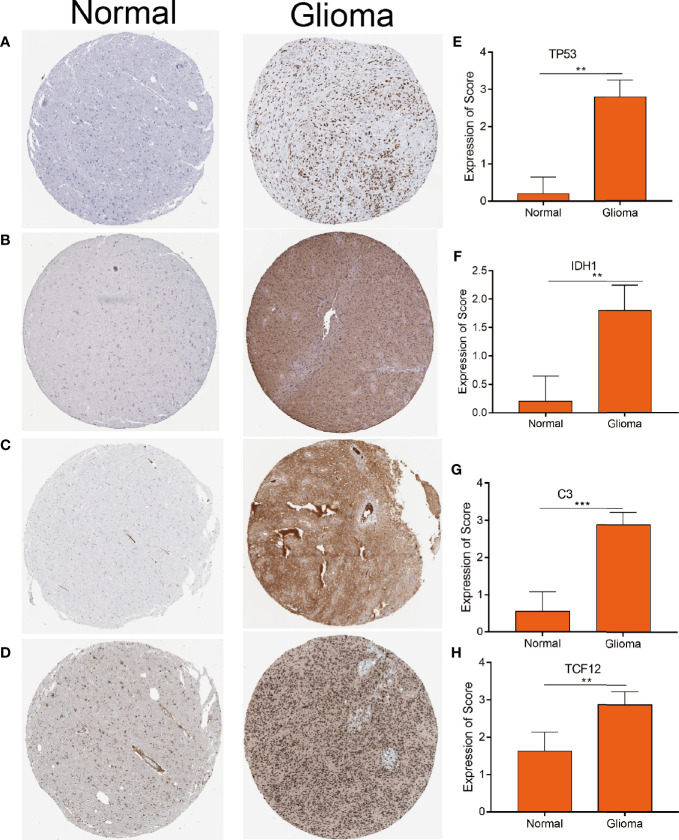
Figure 3.
Distinctively expressed proteins in human glioma tissue and normal brain tissue. (A–D) The protein expression of TP53 (A) IDH1 (B) C3 (C) and TCF12 (D). Representative photos are shown (100×), Scale bar = 100 μm. (E–H) The protein expression scores of glioma tissue and normal brain tissue are shown. ***p < 0.001 by t-test indicated a significant difference from normal tissues. **p < 0.01.

