Figure 4.
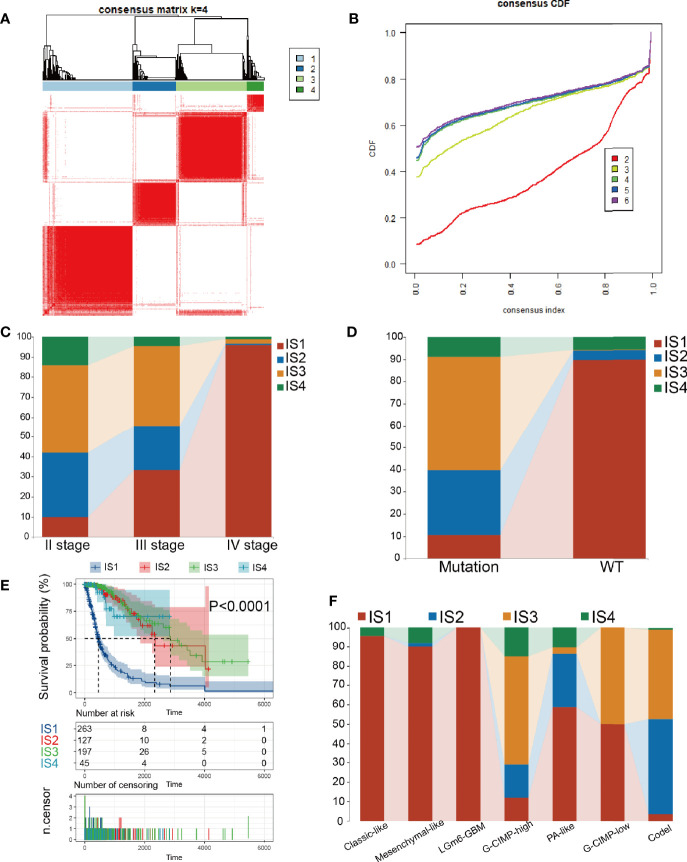
Consensus clustering in TCGA. (A) Color-coded heatmaps corresponding to the consensus matrices. (B) Consensus Cumulative Distribution Function (CDF) Plot for immune-related genes in glioma. (C, D) Distribution of IS1-IS4 between WHO stages and IDH1 types in the TCGA cohort. (E) Kaplan-Meier curves survival based on the 4 glioma immune subtypes in the TCGA cohort. (F) Distribution of IS1-IS4 between methylation types in the TCGA cohort.

