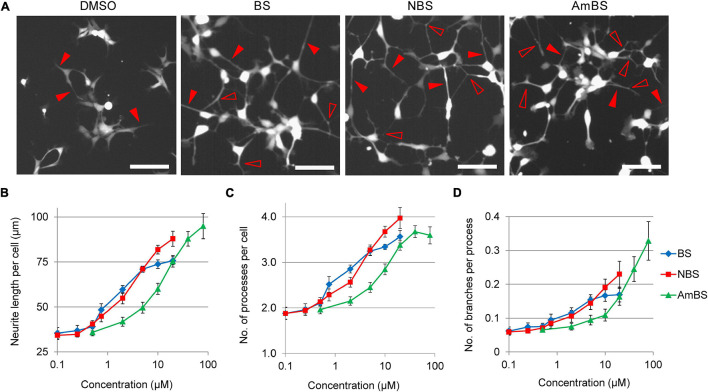
FIGURE 3.
Morphological changes in NPCs treated with blebbistatin or blebbistatin derivatives. (A) Representative images of eGFP-NPCs treated with vehicle (DMSO), 20 μM blebbistatin (BS), 20 μM para-nitroblebbistatin (NBS), or 40 μM para-nitroblebbistatin (AmBS) for 4 h. Filled arrowheads point to selected processes, whereas empty arrowheads indicate branching points of the processes. Scale bars indicate 10 μm. (B–D) Dose response curves for neurite length per cell, the number of projections per cell, and neurite branching in response to BS, NBS, or AmBS. The values were determined 3 h after treatment. The mean ± SEM from three independent experiments are indicated.

